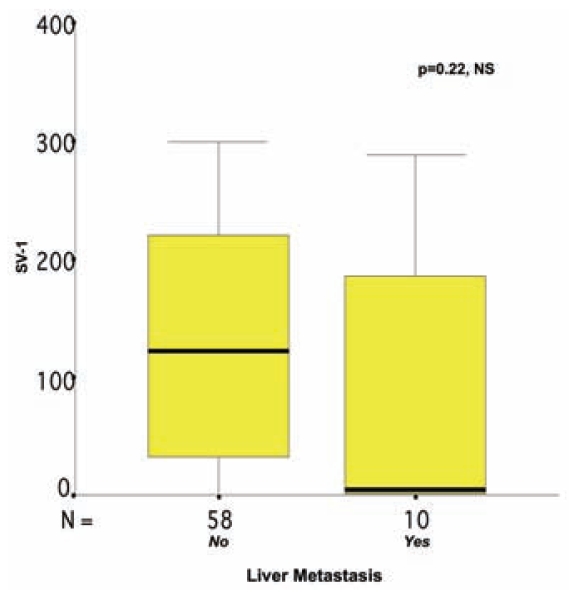
Figure 4.
Correlation between SV-1 immunohistochemical expression and liver metastasis in colorectal cancer. The box plot lines display the 5th, 25th, 50th, 75th, and 95th percentiles. The bold lines represent the median value (50th percentile) for each patient’s cohort. P value was calculated by the Mann–Whitney U test. NS, nonsignificant.

