Fig. 1.
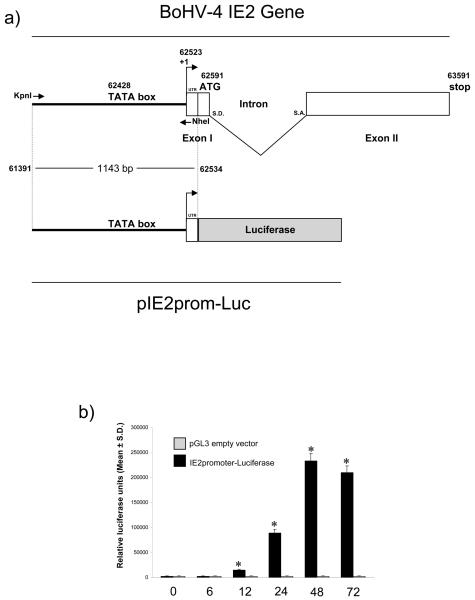
a) Diagram showing the genomic region containing BoHV-4 IE2 gene (not on scale), where the exon II (whit box) contains most of the IE2 ORF, except the translation initiation codon contained in the exon I (whit box) together with the 5′ UTR. The splicing donor (S. D.) and splicing acceptor (S. A.) sites are indicated. During splicing, the intron is removed and the two exons (I and II) are joined together to generate the IE2 ORF. Sense and antisense primers used for the PCR amplification of the promoter region sequence (1,143 bp) are indicated by arrows, spanning the full promoter containing the TATA box and the first 15 non coding nucleotides (UTR) of the first exon. The KpnI and NheI restriction sites have been introduced into the 5′ end of the primers, for sub-cloning the amplicon in front of the Luciferase ORF (grey box) contained into the pGL3 vector. Numbers indicates nucleotide position in the BoHV-4 full genome published sequence (GeneBank accession number: AF318573) (Zimmermann et al. 2001). b) IE2 promoter activity in BES cells at different time post transfection with pIE2prom-Luc or pGL3 empty vector. The data represents the mean relative Luciferase units after normalizing with the cotransfected Renilla activity. Each reaction was done in quadruplicate, and each point represents the average ± standard deviation from three experiments (*P<0.001).

