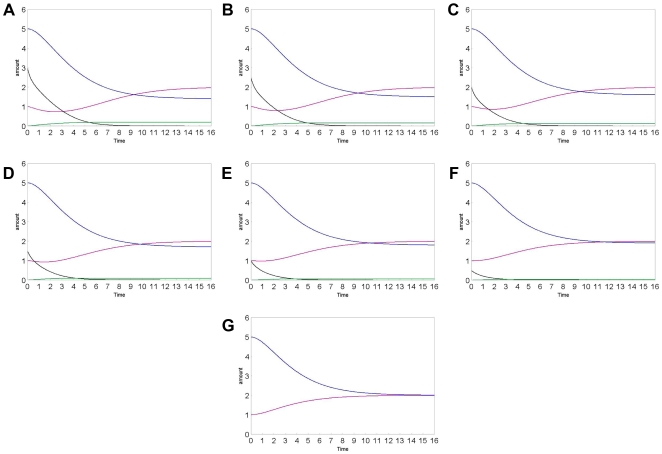
Figure 6. Concentration curves of the various species: methicillin (black), mecA_RNA (green), mecR1_RNA (purple), mecI_RNA (blue) in different simulations, using different METHICILLIN amounts: A: 3; B: 2.5; C: 2; D: 1,5; E: 1; F: 0,5; G: 0.
The various species are distinguished by colours as indicated in the legend. The substance amount and time are expressed in number of molecules and seconds, respectively.

