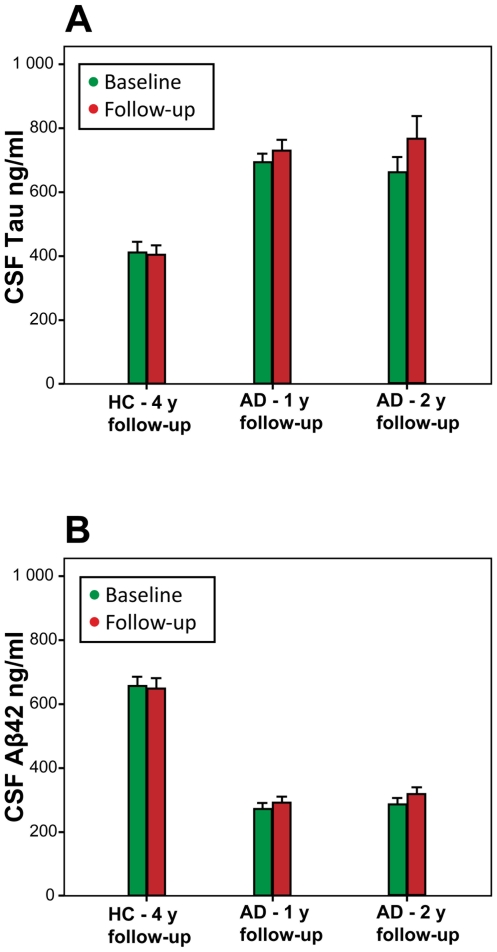
Figure 1. Longitudinal change of CSF tau and Aβ42.
The figure shows the mean baseline and follow-up levels of CSF tau (panel A) and CSF Aβ42 (panel B) in healthy controls (HC), that were followed for 4 years (y), and in two cohorts of patients with Alzheimer's disease (AD) that were followed for one or two years, respectively. Error bars represent standard errors of the mean. The figure illustrates that differences between controls and AD patients by far surpass the within-group differences over time.

