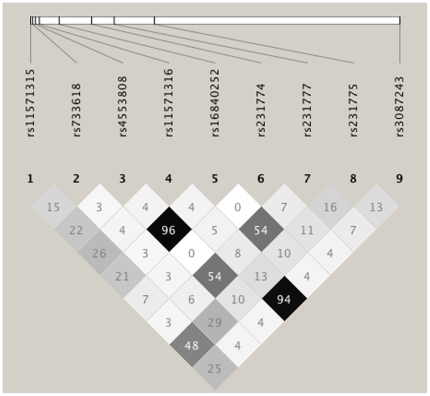
Figure 1. Pairwise linkage disequilibrium (r2) based on 9 CTLA4 SNPs using HaploView 4.0 software.
The figure depicts the strong LD of variants −1577/+6230 and of variants −1147/−1661. The positions relative to the ATG start codon of SNPs are given in Table 2.

