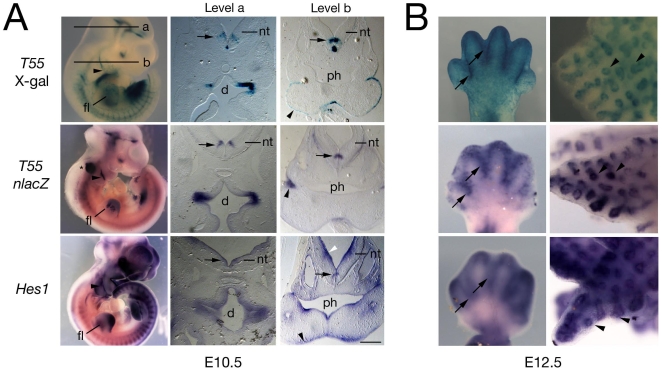
Figure 3. Comparison of T55 and Hes1 expression during embryonic development.
(A) E10.5 wholemount embryos (left) and cryosections after X-gal staining (top) or in situ hybridization with a lacZ (T55 embryo, middle) or Hes1 riboprobe (bottom). The transgene is expressed at a subset of sites of Hes1 expression including the forelimb (fl), pharyngeal region (including ectoderm, arrowheads), neural tube (nt), including a specific population of neurons in the ventral neural tube (arrows) and diencephalon (d); ph, pharynx. Asterisk indicates probe trapping in the otic vesicle. (B) E12.5 forelimb (left) and lung (right) after X-gal staining (top) and nlacZ (middle) or Hes1 (bottom) in situ hybridization, showing similar transgene and Hes1 expression in the interdigital region (arrows) and pulmonary epithelium (arrowheads). Scale bar: 200 µm.

