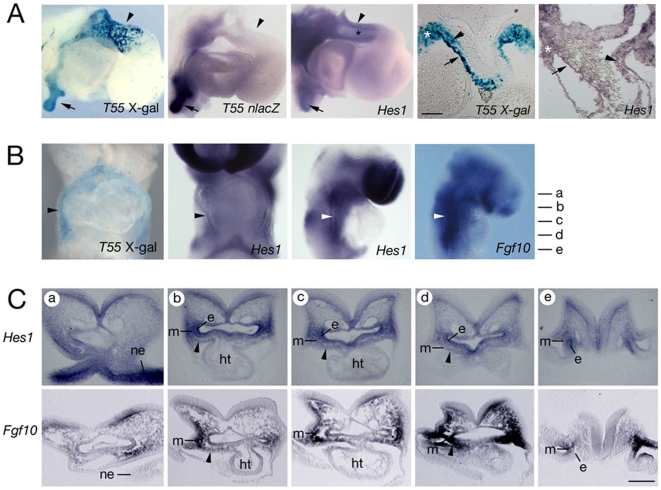
Figure 4. Hes1 is expressed in the second heart field.
(A) Comparison of transgene and Hes1 expression in right lateral views of hearts after X-gal staining and in situ hybridization at E10.5 (left three panels). X-gal positive cells are observed in the distal OFT wall (arrowhead) and pulmonary endoderm (arrow); nlacZ transcripts are observed in pulmonary endoderm but not the OFT. Low-level Hes1 transcript accumulation is observed in the distal OFT (black asterisk). Transverse sections (right two panels) show β-galactosidase and low-level Hes1 transcript accumulation in the pericardial region (white asterisks), superior OFT wall (arrow) and mesenchymal cells in the OFT (arrowhead). (B) At E8.5 X-gal and Hes1 positive cells are observed in ventral and right views in the pericardial wall (black arrowhead) and pharyngeal mesoderm (white arrowheads) where Fgf10 transcripts also accumulate. (C) E8.5 sections at the levels indicated in (B), showing Hes1 transcripts in neuroepithelium (ne), endoderm (e) and mesoderm (m) lateral and ventral to the pharynx, including the SHF (arrowheads), compared with Fgf10 expression. Note that caudally (level e) Hes1 and Fgf10 transcripts are observed in endoderm and mesoderm respectively. ht, heart tube. Scale bars: (A, C) 100 µm.

