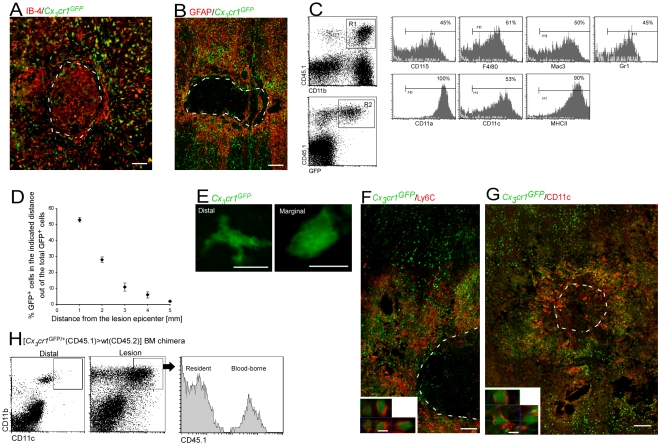
Figure 2. Monocyte-derived macrophages acquire a unique phenotype in close proximity to the lesion site.
Chimeric mice were subjected to SCI and analyzed a week later for homing of cells. (A) Cells labeled for IB-4 (red), and GFP (green) at the lesion site of [Cx3cr1 GFP/+>wt] BM chimeric mice. (B) Cells labeled for GFAP (red) and GFP (green), demonstrating that the infiltrating myeloid cells barely penetrate the lesion epicenter. (C) Representative flow cytometric analysis showing the extent of expression of various markers by the infiltrating myeloid cells (CD11b+/ Cx3cr1 GFP/+/CD45.1+) in the injured spinal cords of [Cx3cr1 GFP/+ (CD45.1)>wt (CD45.2)] BM chimeras. The numbers above the bars refer to the percentage of the cells positive for the indicated marker out of the R1×R2 population (representing the infiltrating monocytes). The bars point to cells positive for the indicated marker (isotype control, gray line). (D) Spatial distribution map of monocyte-derived MΦ (GFP+) at specific distances relative to the epicenter of the lesion site in [Cx3cr1 GFP/+>wt] BM chimeras based on immunohistochemical analysis. (E) High magnification of GFP+ cells (green) from distal and marginal areas of the lesion, demonstrating morphological differences. (F) Representative confocal micrograph of longitudinal sections from injured spinal cord of [Cx3cr1 GFP/+>wt] BM chimeras, labeled for Ly6C (red), and infiltrating monocyte-derived MΦ by GFP (green). Lower panel: z-axis projection of a single cell. (G) Representative confocal micrograph of longitudinal sections of injured spinal cord, labeled for monocyte-derived MΦ by GFP (green) and CD11c (red). Lower panel: z-axis projection of single cell. (H) Flow cytometric analysis of distal and lesion spinal cord samples for CD11c expression on MΦ (CD11b+ cells) in [Cx3cr1 GFP/+(CD45.1)>wt(CD45.2)] BM chimeras. Note the higher incidence of CD11chigh cells in the lesion sample. The histogram to the right is gated on CD11b+/CD11chigh cells at the lesion area, showing that both resident (CD45.1−) and infiltrating (CD45.1+) cells express CD11c. The dashed line demarcates the lesion site in (A), (B), (F), and (G), as determined by GFAP immunoreactivity. Scale bar in (B) and (G), represents 250 µm; in (A) and (F), 100 µm; in (E), and lower panels of (F) and (G), 10 µm. Five mice were analyzed in each group.

