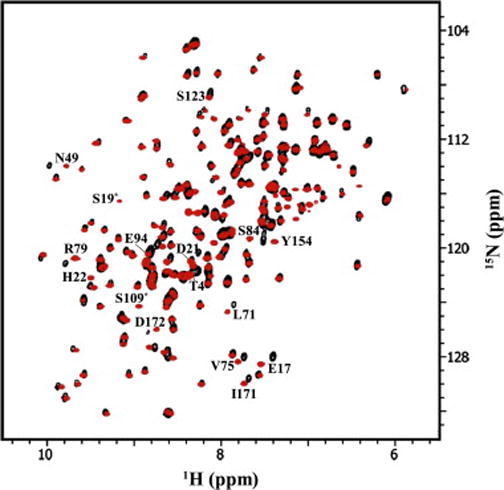
Fig. 2.

2D 15N-1H HSQC spectrum of 500 μM [U-, 15N] HGD (black contours), and 500 μM [U-, 15N] P23T (red contours). Residues with large average amide chemical shift differences between the two proteins are marked (compare with Figs. 3 and 4). The contours marked with an asterisk(*) are those for which HGD contours are not visible at this contour level.
