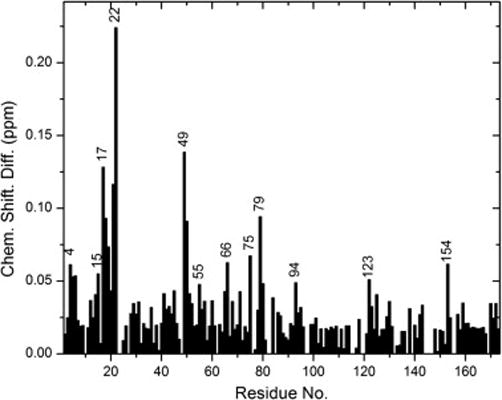
Fig. 3.

Average amide chemical shift difference for all the assigned residues in HGD and P23T. The average is weighted average of the 1H and 15N chemical shifts calculated as [(Δδ2NH+Δδ2N/25)/2]1/2 (see text for details). The residue numbering for the C-terminal end (i.e. 87 to 174) was shifted up by one residue to match the numbering in the x-ray structure [5]. Only high (greater than 0.1 ppm) and moderate (between 0.1 ppm and 0.05 ppm) chemical shift differences are indicated by the individual residue numbers. For the sake of clarity, all consecutive residues have not been marked.
