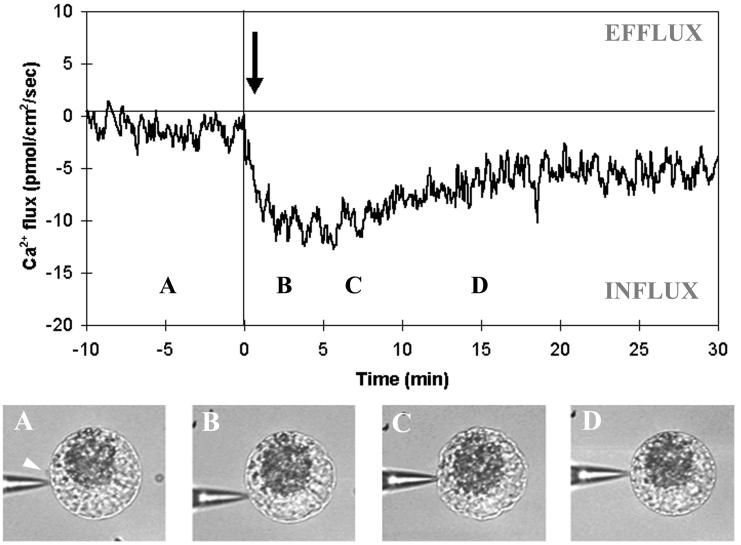
Figure 3.
Ca2+ flux measurements during maize IVF. A typical recording is shown (n = 61) illustrating the onset of a Ca2+ influx after fusion. Time 0 is chosen arbitrarily as the time of gametic fusion, as asserted by direct microscopic observation. The arrow shows the detectable onset of a Ca2+ influx after fusion. A clear Ca2+ influx was always detected in the egg membrane, with a delay to fusion dependent on the relative position of the probe and fusion site (black arrow in Fig. 1). A, B, C, and D refer to the time when the pictures (Bottom) were taken. The following events are depicted: (A) egg cell before fusion (male gamete position is shown by a white arrow); (B) egg cell after fusion, just when contraction has started; (C) strong egg cell contraction; and (D) egg cell reshaping.

