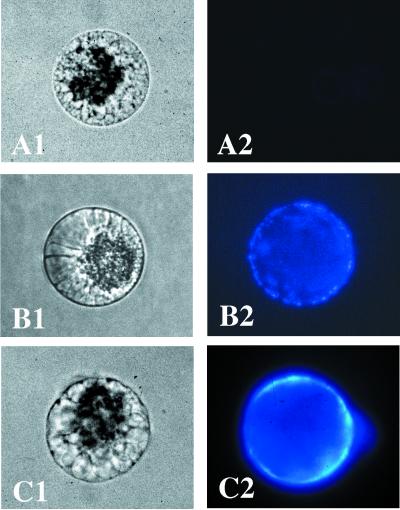
Figure 5.
Cell wall establishment around egg cells after fertilization or Ca2+ ionophore treatment. Transmission micrograph (A1) and fluorescent micrograph (A2) of an isolated egg cell. Transmission micrograph (B1) and fluorescent micrograph (B2) of a 2-h zygote. Transmission micrograph (C1) and fluorescent micrograph (C2) of egg cells 2 h after incubation for 40 min with A23187. (Bar = 20 μm.)

