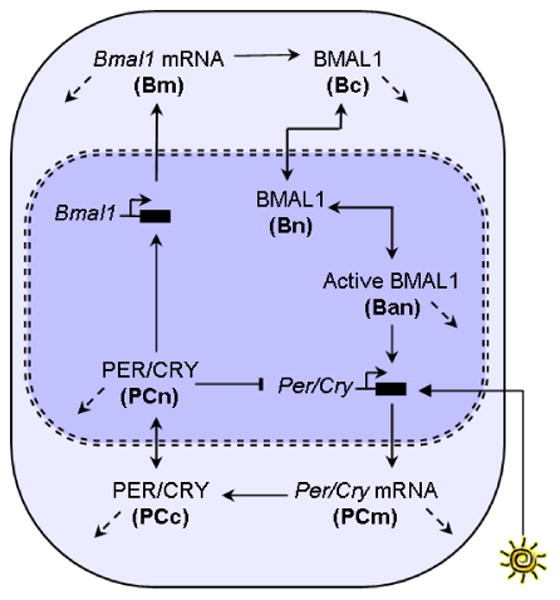
Fig. 1.

Circadian clock model network. The diagram is adapted from Fig 1 in (Geier et al, 2005). The bold letters denote the states. The solid arrows indicate positive influence. For example, greater concentration (up regulation) of Bmal1 mRNA causes greater concentration of cytoplasmic BMAL1. The flat-headed arrows indicate negative influence. For example, nuclear PER/CRY inhibits the transcription of Per/Cry mRNA . The dashed arrows indicate degradation. There is a negative feedback loop formed by the mRNA and protein versions of Per/Cry. Interlocked with it is a positive feedback loop involving Bmal1 mRNA, BMAL1 protein, and Per/Cry. Light enters the system by modulating the transcription rate of Per/Cry mRNA (PCm). In this study, we use the gating function associated with nocturnal animals.
