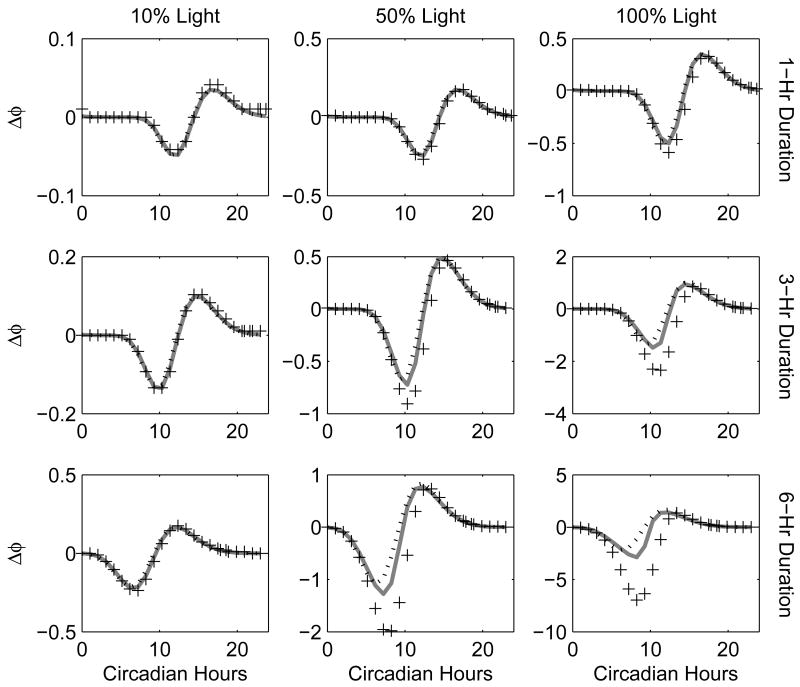
Fig. 7.
Numerical experimental PRCs. Each plot contains the phase shifts for the numerical experimental PRC (pluses), pIPRCL-predicted PRC (solid gray line), and APRCL-predicted PRC (dotted black line). The signal is sinusoidal and its active part lasts 1 hour for the first row, 3 hours for the second row, and 6 hours for the third row. The signal maximum is at 10%, 50%, and 100% of full light, respectively. Notice the different scales on the y-axes.

