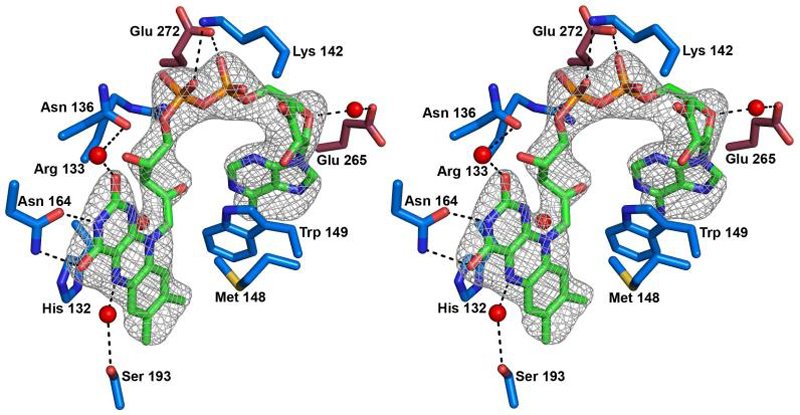
Figure 3.

Stereo view of the FAD cofactor in PAS-A and interacting residues. Residues from PAS-A have blue carbon atoms, residues from PAS-B have raspberry carbon atoms, and the FAD has green carbon atoms. Nitrogen atoms are blue, oxygen atoms are red, sulfur atoms are yellow, and phosphorus atoms are orange. Water molecules are shown as red spheres. An omit electron density map of the FAD contoured at 3σ is superimposed.
