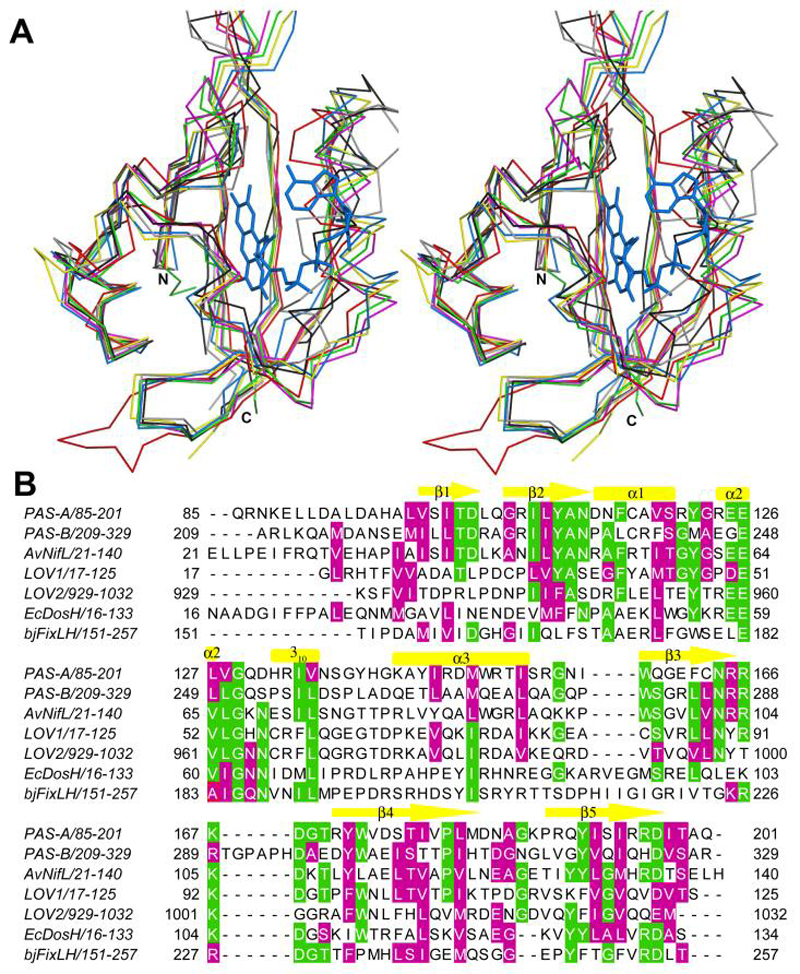
Figure 4.

Comparison of MmoS PAS domains to other PAS domains. (A) Superposition of PAS-A (blue), PAS-B (red), A. vinelandii NifL (yellow, PDB accession code 2GJ3), C. reinhardtii LOV1 (green, 1N9O), phy3 LOV2 (magenta, 1JNU), E. coli27DosH (black, 1V9Z), and B. japonicum FixLH (gray, 1XJ6). The FAD cofactor in PAS-A is shown as blue sticks. The heme cofactors in DosH and FixLH are not shown. (B) Structure based sequence alignment of structures shown in (A). Identical residues are highlighted green and similar residues are highlighted magenta. The secondary structure elements for MmoS PAS-A are indicated.
