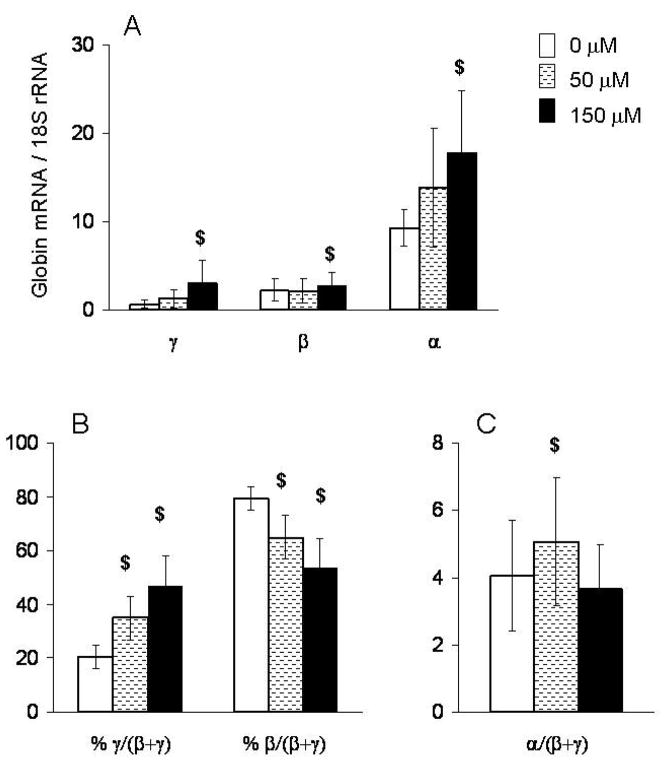
Figure 1. Effects of different concentrations of butyrate on the expression of γ-, β- and α-globin genes.
Mononuclear cells from patient #4 with β-Thal intermedia were cultured at 50 μM and 150μM concentrations of butyrate. mRNA levels in BFU-E derived colonies were measured by quantitative real-time RT-PCR and expressed as (A) absolute levels, (B) % γ/(β+ γ), % β/(β+ γ) and (C) ratio α/(β+γ). In each experiment, each sample had triplicates $: p≤0.05.

