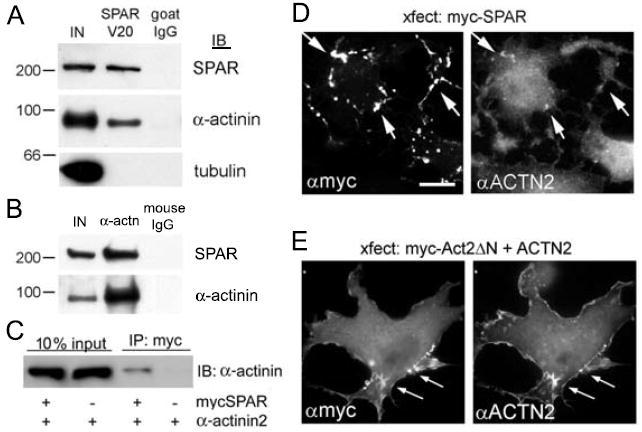
Figure 2. Biochemical and immunocytochemical association of SPAR and α-actinin.

(A) Rat brain lysates were immunoprecipitated with SPAR V20 goat antibodies or with nonimmune goat IgG control, and precipitates were immunoblotted for SPAR, α-actinin and tubulin as indicated.
(B) Rat brain lysates were immunoprecipitated with mouse monoclonal antibodies to α-actinin or with nonimmune mouse IgG control, and precipitates were immunoblotted for SPAR and α-actinin. IN represents 10% of input used in each immunoprecipitation reaction in (A, B).
(C) COS-7 cells transfected with myc-tagged SPAR or α-actinin2 as indicated were immunoprecipitated with myc agarose and immunoblotted for α-actinin. 10% of input is shown as expression control. (D-E) COS-7 cells transfected with myc-tagged SPAR alone (D) or with mycAct2ΔN domain of SPAR together with α-actinin2 (E). Cells were immunostained with myc and α-actinin antibodies, as indicated. Arrows show examples of colocalization. Scale, 5 μm.
