
Figure 4. SPAR and α-actinin2 regulation of dendritic spine morphogenesis.
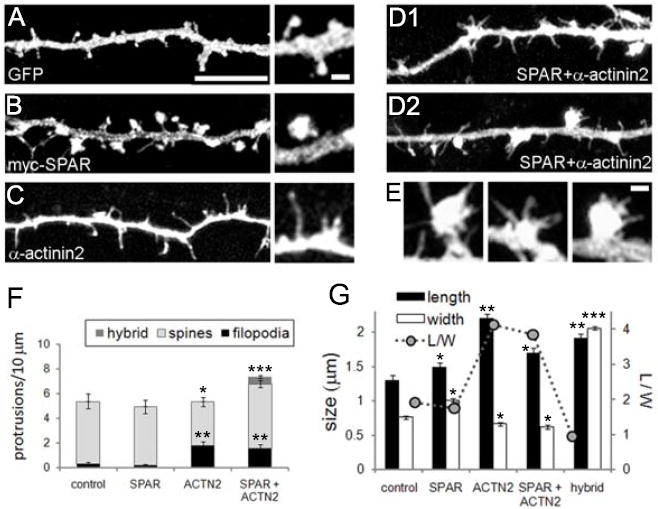
(A-E) Cultured hippocampal neurons (15 DIV) were transfected with DNA constructs as indicated and with pEGFP to visualize neuronal morphology. Insets show higher magnification views of representative dendritic protrusions. (E) Representative hybrid spine/filopodia from transfected neurons in (D), shown at same scale as higher magnification insets in (A-C). Scale bars: 5 μm for dendrite images and 1 μm for all higher magnification images. (F) Quantification of dendritic spine morphological classifications as indicated. Hybrid refers to combination spine/filopodia protrusions. (G) Dendritic protrusion length, width, and length-to-width ratio (L/W) for transfected neurons as indicated. *p<0.05, **p<0.01, ***p<0.001, compared to control.