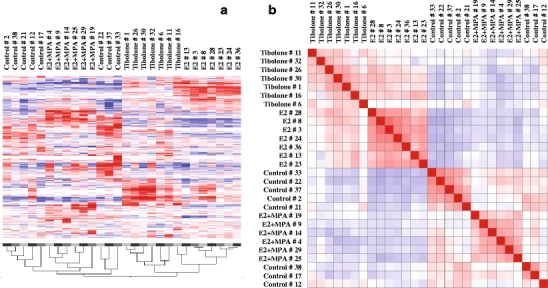
Fig. 2.

Cluster and correlation analyses of endometrial gene expression profiles obtained after short-term (21 days) treatment with E2, E2 + MPA, or tibolone. Using statistical analysis, it was established that 3,293 probe sets (representing 2,312 known and 466 unknown genes) deviated at least threefold, in at least one patient sample, from the geometrical means of all treated samples. These genes were used for the cluster and correlation analyses. a At the bottom of the figure, relatedness is indicated. Red indicates genes with a higher expression relative to the geometrical means, while blue indicates genes with a lower expression relative to the geometrical means. The numbers (#) behind the treatments indicate the patient numbers. b The correlation values are between 1 (dark red, diagonal line) and −1 (dark blue, not represented here). The white boxes represent no correlation between profiles
