
Fig. 3.
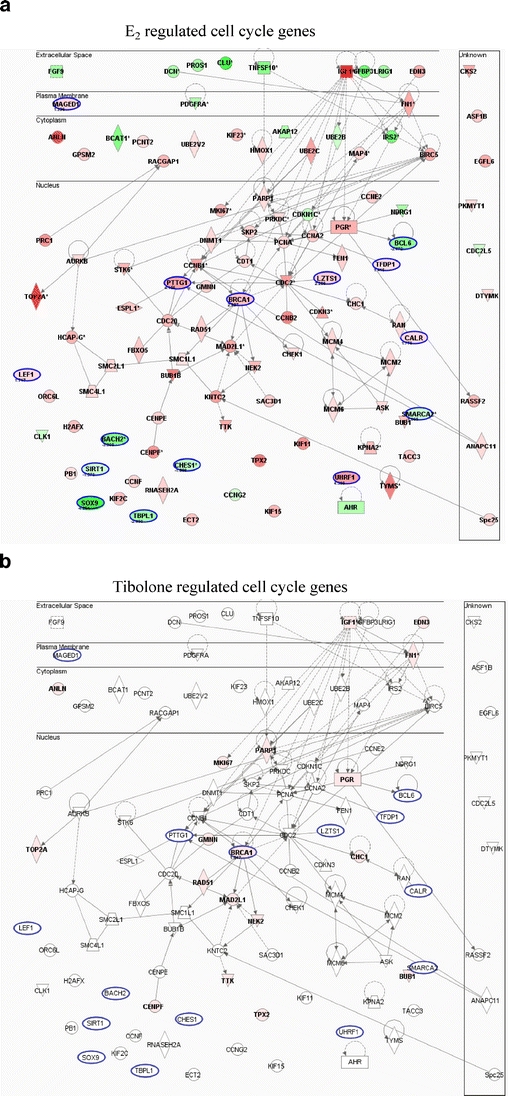
A gene expression network of E2- and tibolone-regulated genes involved in the regulation of the cell cycle. From top to bottom, genes are acting in extracellular space, plasma membrane, cytoplasm, or nucleus. The colors indicate upregulation (red), downregulation (green) or no regulation (not colored). The intensity of colors indicates the magnitude of regulation (darker means more pronounced). Relations between genes are indicated with gray lines and functions of genes by the shape of the gene name boxes. Rectangle Nuclear receptor, square cytokine, vertical diamond enzyme, horizontal diamond peptidase, triangle kinase, quadrangle transporter, ellipse transcription factor, circle other function