
Fig. 4.
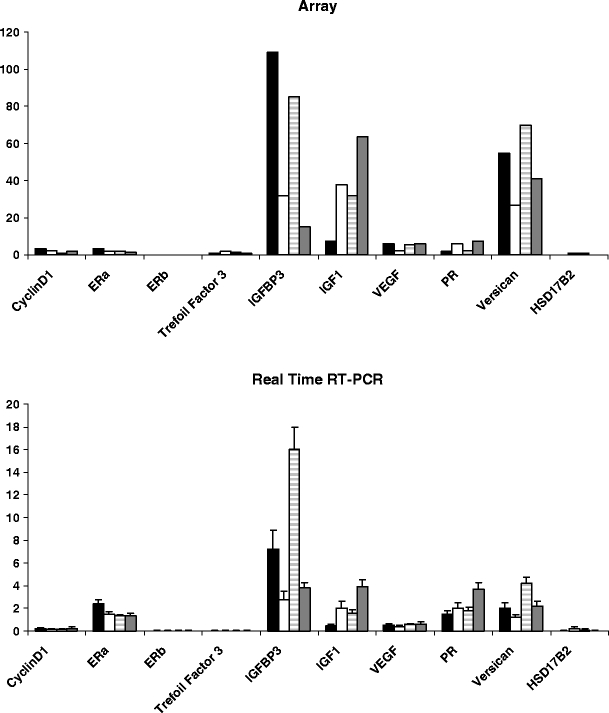
Array data compared to RT-PCR results. The array signal intensities (top) of tested genes were normalized relative to GAPDH. The RT-PCR signals (bottom) were normalized relative to 18sRNA signals. Solid black bars represent data from control patients, solid white bars represent data from tibolone-treated patients, dashed gray bars represent data from E2 + MPA treated patients, and the solid gray bars represent data from E2-treated patients