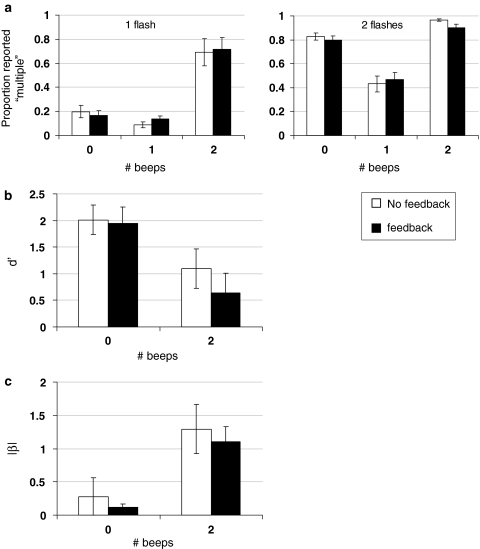
Fig. 1.
Experiment 1 results. a The raw data. Data from trials with 1 flash and 2 flashes are shown on the left and right panel, respectively. The y-axis represents the proportion of trials in which the participants reported seeing more than one flash. The x-axis represents the different sound conditions. The no-feedback and feedback conditions are shown in white and black, respectively. b Perceptual sensitivity, d′ in no-sound and 2-beep trials. c Absolute criterion bias |β|. Error bars, here and in the following figures, indicate standard error of the mean

