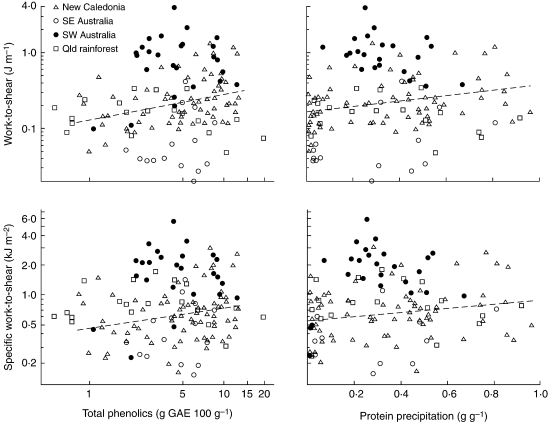
Fig. 1.
The relationship between leaf toughness (work-to-shear and specific work-to-shear, both plotted on a log scale) and phenolic concentration (total phenolics and tannin activity, the latter measured as protein precipitation) across all species. Species from New Caledonia (maquis, dry forest and rainforest), south-eastern Australia (eucalypt forest understorey species), south-western Australia (kwongan and eucalypt woodland) and tropical rainforest in north Queensland. Each data point is the mean of 2–5 replicate plants. The line of best fit is shown (derived by Model 1 regression) for New Caledonian species (Table 1).

