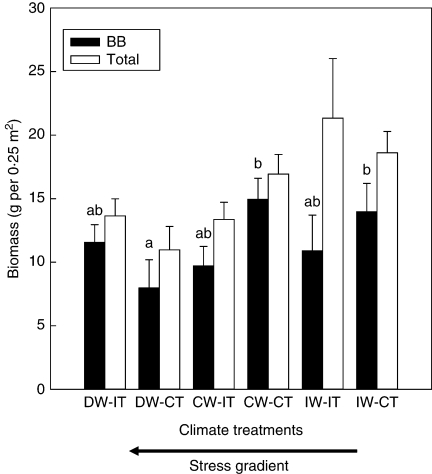
Fig. 4.
Effects of the water and temperature treatment combinations (+s.e.) on bluebunch wheatgrass (BB) and total biomass (n = 50). D, Decreased; C, control; I, increased; W, water; T, temperature. Bars sharing the same letters are not significantly different (P > 0·10) using Tukey's test. The arrow below the x-axis shows the directional increase in climate stress. There was no significant interaction treatment effect on total biomass; therefore no letters are displayed.

