
Figure 3.
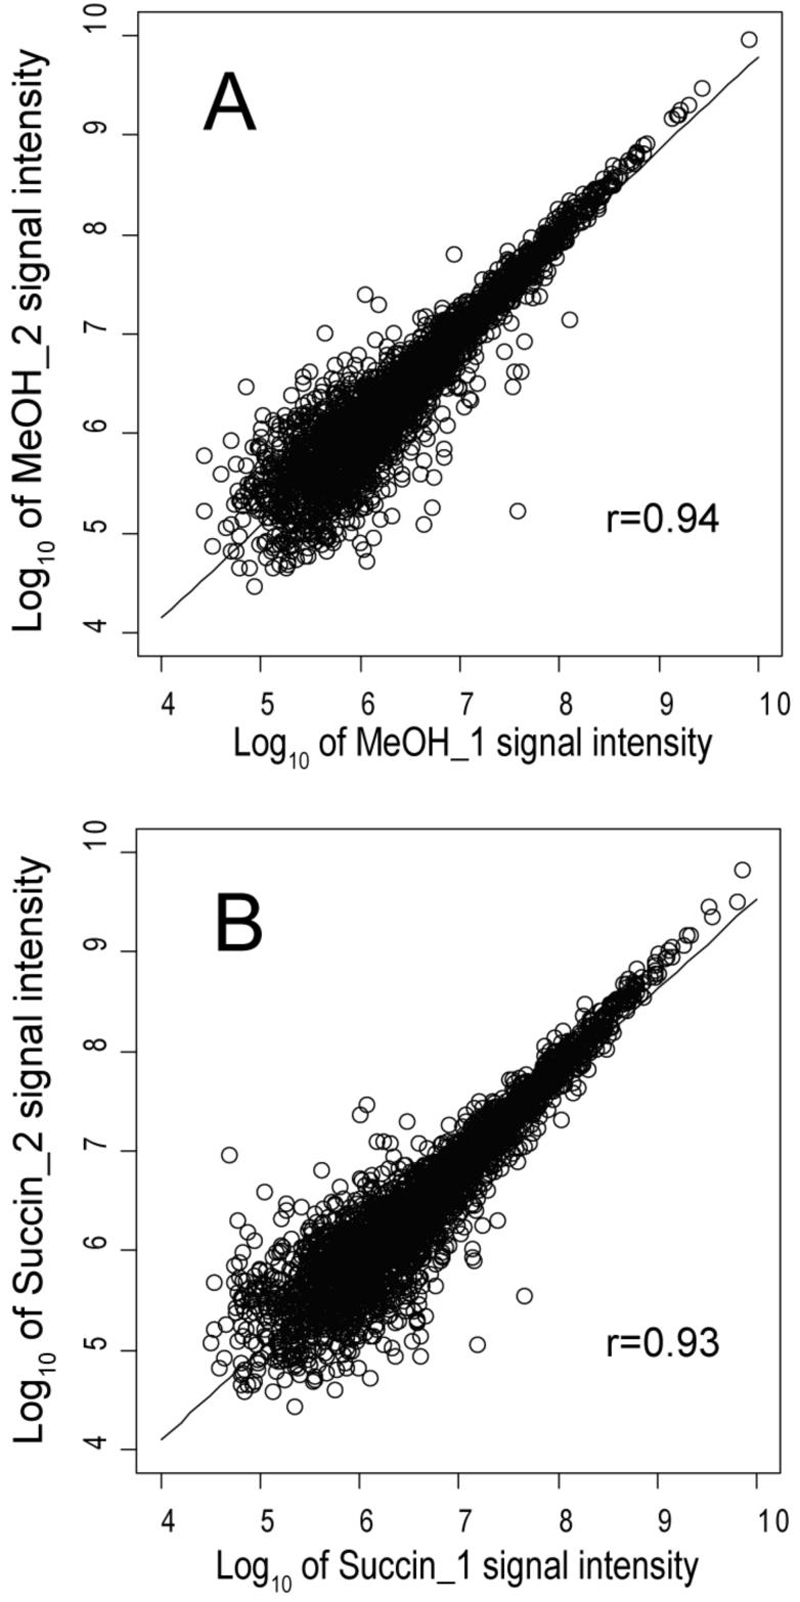
Scatter plot and linear regression showing the reproducibility of summed signal intensities for the biological replicates of methanol and succinate. (A), Plot of 2,959 proteins common to both replicates for methanol. (B), plot of 3,115 proteins common to both replicates for succinate.