
Figure 4.
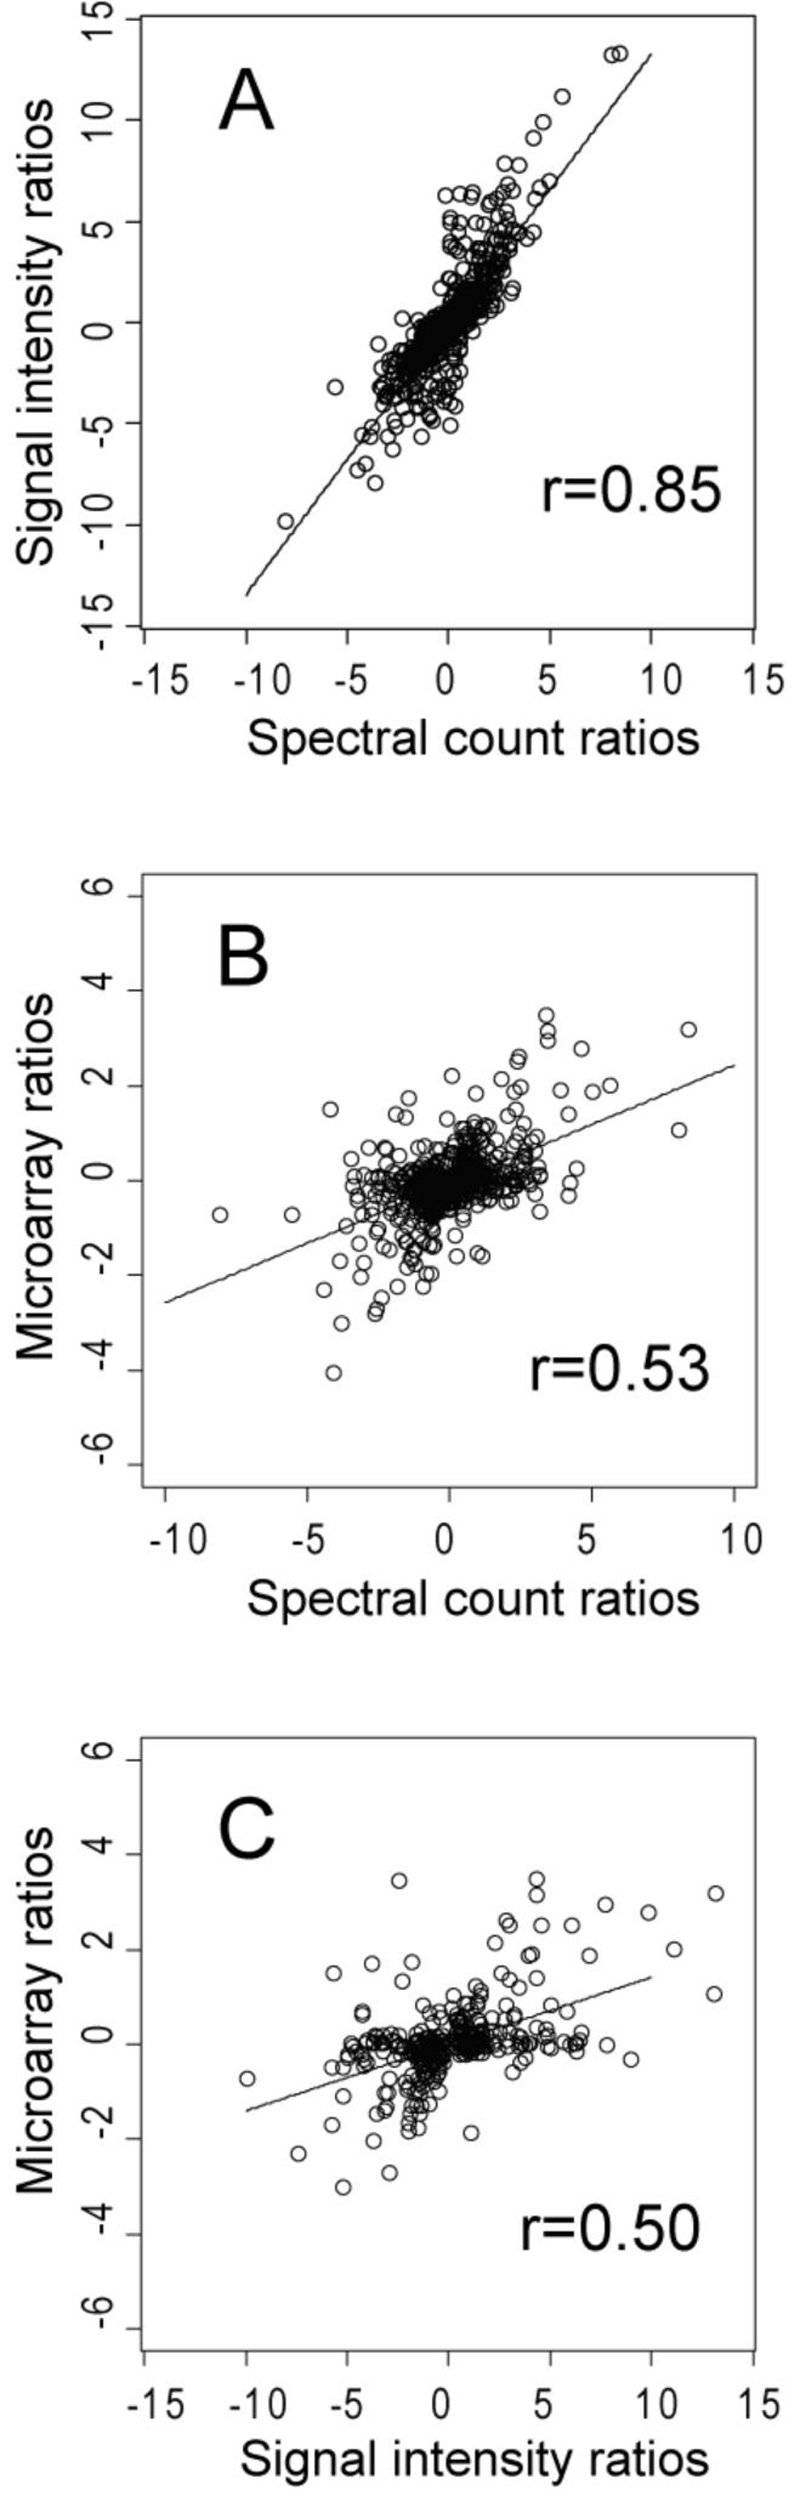
Scatter plots and linear regression for (A), the log2 protein abundance ratios calculated by summed signal intensity versus spectral counting for 762 proteins judged to be significantly changed by either method; (B), the log2 mRNA abundance ratios [16] versus the log2 spectral count proteomic abundance ratios for 585 ORFs showing significant change in protein abundance; and (C), the log2 mRNA abundance ratios [16] versus the log2 summed signal intensity proteomic abundance ratios for 317 ORFs showing significant change in protein abundance.