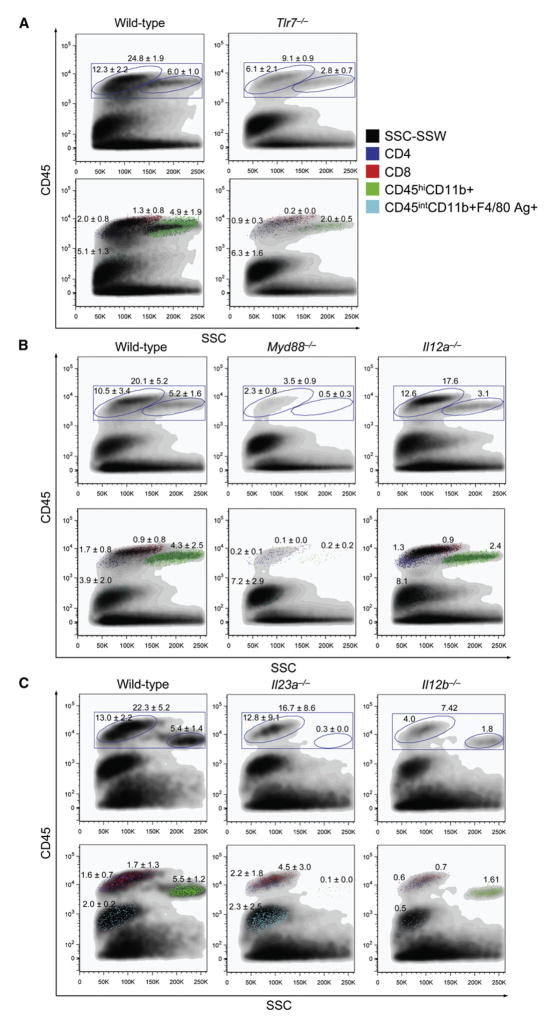
Figure 7. Characterization of Brain Immune Cells in Wild-Type, Tlr7−/− −/−, Myd88−/−, Il12−/−, and Il23−/− Mice after West Nile Virus Infection.
Brain flow cytometry results are shown from 2–3 independent experiments on day 6 post-WNV infection (LD50; n = 1–5 mice per genotype and numbers represent percentages ± SD for the indicated gates). The 37:70% Percoll interface was collected and stained for CD45, CD4, CD8, CD11b, and F4/80 antigen as indicated in (A) (right, applies for all panels). A minimum of 100,000 events were collected for flow cytometry analysis, and dot plots show side scatter (SSC) on the x axis and CD45 log fluorescence intensity on the y axis. Numbers represent percentages of positive cells within gated regions.
(A) Brain flow cytometry results are shown from wild-type vs. Tlr7−/− mice.
(B) Brain flow cytometry data are shown for wild-type compared to Myd88−/− or Il12a−/− mice.
(C) Brain flow cytometry data are shown for wild-type compared to Il23a−/− or Il12b−/− mice.

