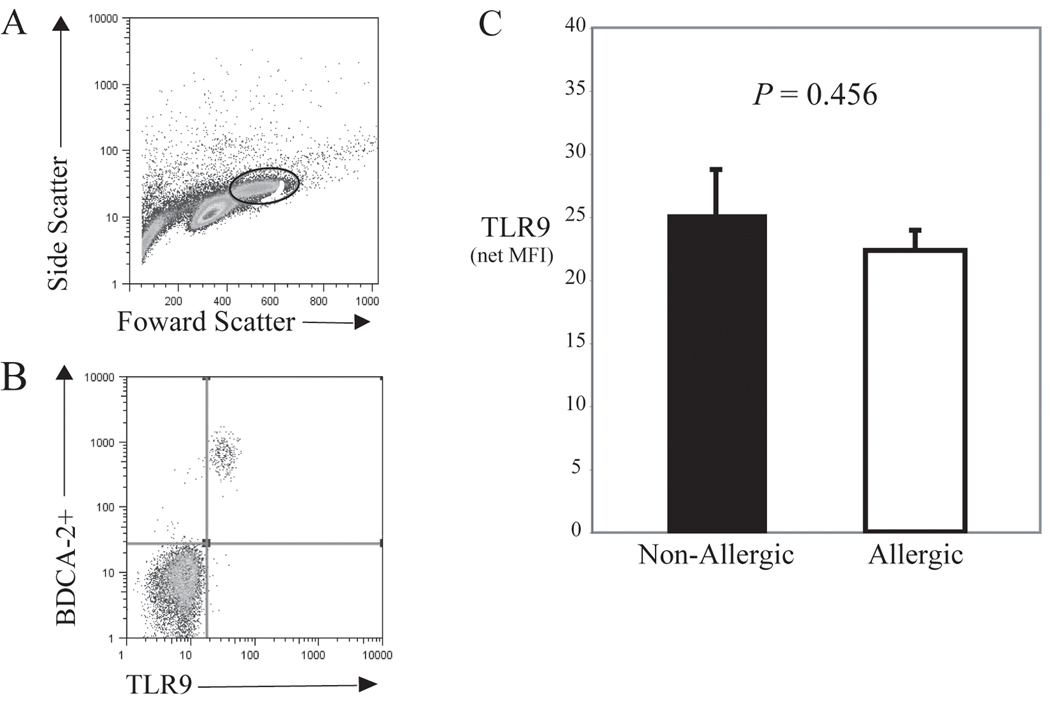
FIG 2.
A, Representative flow cytometric data from BDC suspensions are shown in a scatter plot with the indicated area gated for analysis of intracellular TLR9 expression in pDCs. B, A plot from a representative atopic individual indicating that virtually all BDCA−2+ cells (pDC) coexpress intracellular TLR9. C, Bar graph showing the averaged net MFI ±SEM for TLR9 expressed in non-allergic (n=11) vs. allergic (n=9) subjects, with no significant differences detected (P=0.456).

