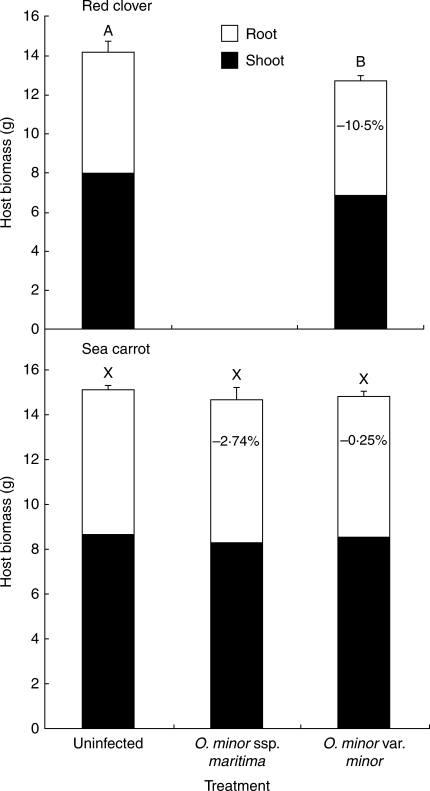
Fig. 6.
Mean host biomass from pot-cultivated red clovers and sea carrots, separated into shoot and root tissue. Numbers in columns represent percentage reduction in total host biomass compared with controls. Results presented as means ± s.e. (n = 10). Columns sharing the same letter are not significantly different (A + B: t-test, P > 0·05; X: ANOVA, P > 0·05).

