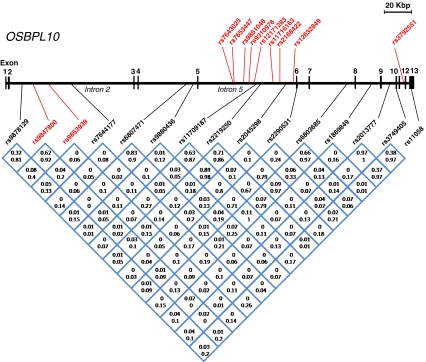
Fig. 1.
Location and linkage disequilibrium (LD) relationships of the investigated SNPs in OSBPL10. Exons 1–13 as well as introns 2 and 5 are indicated. The SNPs analyzed in the low-HDL and FCHL family materials are shown below the gene structure; those with the highest LOD scores (>2.0) for linkage with high-TG trait are indicated in red. The LD relationships between the SNPs are depicted at the bottom; Numbers represent r2, the top one for FCHL and the bottom one for low-HDL families. The SNPs showing strongest association (p < 0.01) with high TG in the Genmets data set are displayed (in red) above the gene structure

