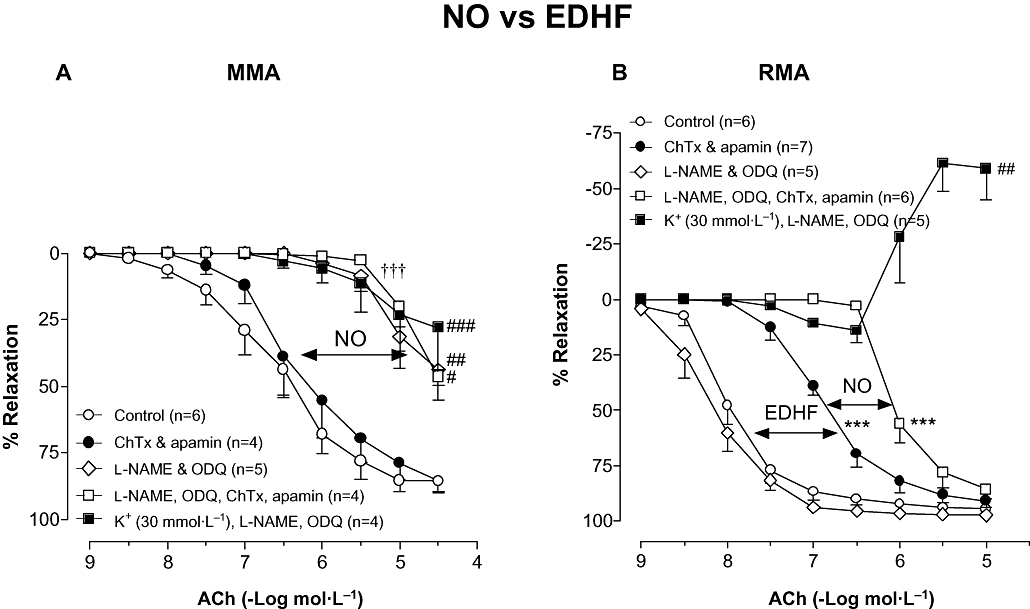
Figure 1.

Concentration–response curves to ACh in (A) MMA and (B) RMA in the absence (Control) or presence of ChTx (100 nmol·L−1) & apamin (100 nmol·L−1) in combination, l-NAME (100 µmol·L−1) & ODQ (100 µmol·L−1) in combination, l-NAME, ODQ, ChTx & apamin in combination and K+ (30 mmol·L−1), l-NAME & ODQ in combination. Indomethacin (10 µmol·L−1) was present throughout. Values are expressed as % reversal of pre-contraction and given as mean ± SEM, where n = number of animals. ***P < 0.001 for pEC50 versus untreated control (one-way anova), †††P < 0.001 versus untreated control (two-way anova), #P < 0.05, ##P < 0.01, ###P < 0.001 for response at 10 µmol·L−1 or 30 µmol·L−1 versus untreated control (one-way anova). ACh, acetylcholine; ChTx, charybdotoxin; EDHF, endothelium-derived hyperpolarizing factor; l-NAME, Nω-Nitro-L-arginine methyl ester; MMA, mouse mesenteric arteries; NO, nitric oxide; ODQ, 1H-[1,2,4]oxadiazolo[4,3-a]quinoxaline-1-one; RMA, rat mesenteric arteries.
