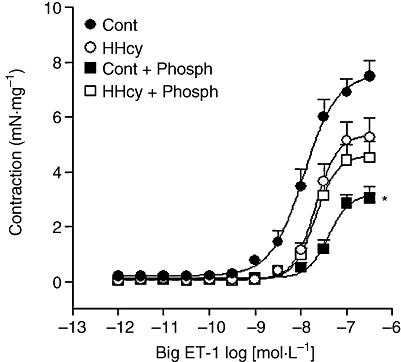
Figure 6.

Concentration–response curves for big ET-1 obtained in endothelium-intact carotid rings from control (Cont) and HHcy rats, in the absence or presence of phosphoramidon (Phosph; 10 mmol·L−1). Values are means ± SEM from five preparations in each group. *Compared with respective Cont group in the absence of inhibitor (one-way anova followed by Bonferroni's multiple comparison test, P < 0.05). HHcy, hyperhomocysteinemia.
