
Figure 3.
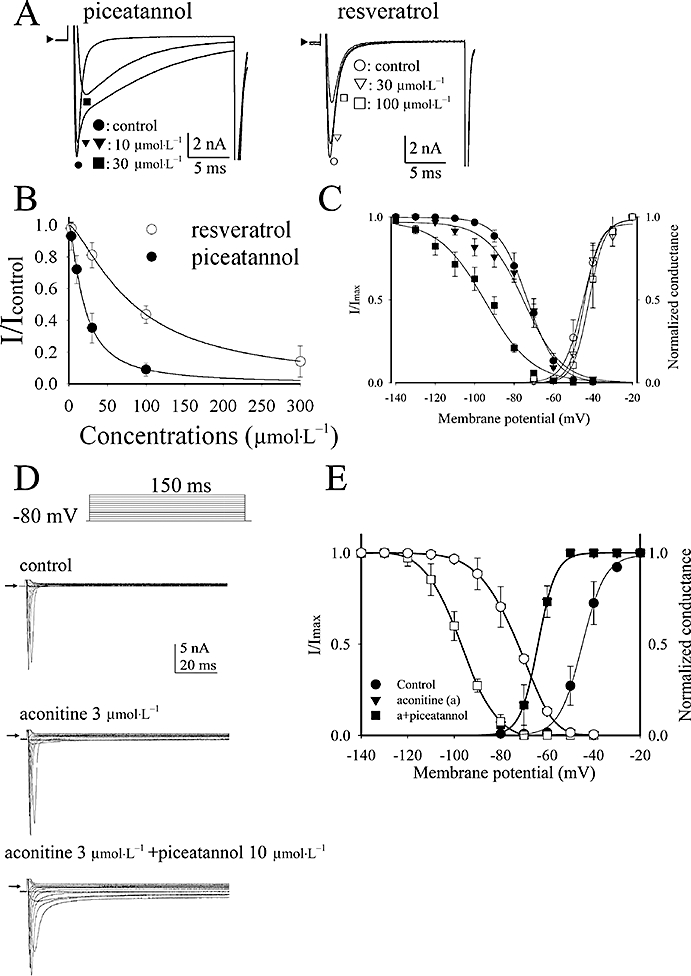
(A) Comparison of the different effect of piceatannol and resveratrol in rat cardiac sodium current elicited by a 20 ms step pulse form holding potential −80 mV to −10 mV. (B) The dose-response curves of INa inhibition by piceatannol and resveratrol. The curves are fitted with Hill equation (1). (C) The voltage-dependent steady-state inactivation and activation curves of sodium channel before and after exposure to piceatannol are plotted and the respective curves are fitted with Boltzman equations (2). Data are shown in mean ± SEM (n= 6). (D) Effect of piceatannol in aconitine-modulated sodium current. For measurement of the activation curves of INa, the membrane potential was held on −80 mV, and sodium currents were elicited by a family of depolarizing pulses for 150 ms from −70 mV stepped to +40 mV by 10 mV every step once per 5 s. The typical sodium current traces in response to aconitine (3 µmol·L−1) in the absence and presence of piceatannol (10 µmol·L−1). The arrowheads indicate the current level at zero. (E) For measurement of the steady-state inactivation curves of INa, INa was elicited by stepping to 0 mV for 20 ms from different holding potentials ranging from −140 mV to −40 mV increased by 10 mV every 10 s. The steady-state inactivation and activation curves of sodium channel in the conditions of control, aconitine (A) 3 µmol·L−1, and aconitine plus piceatannol 10 µmol·L−1. The curves are fitted with Boltzman equations (2).