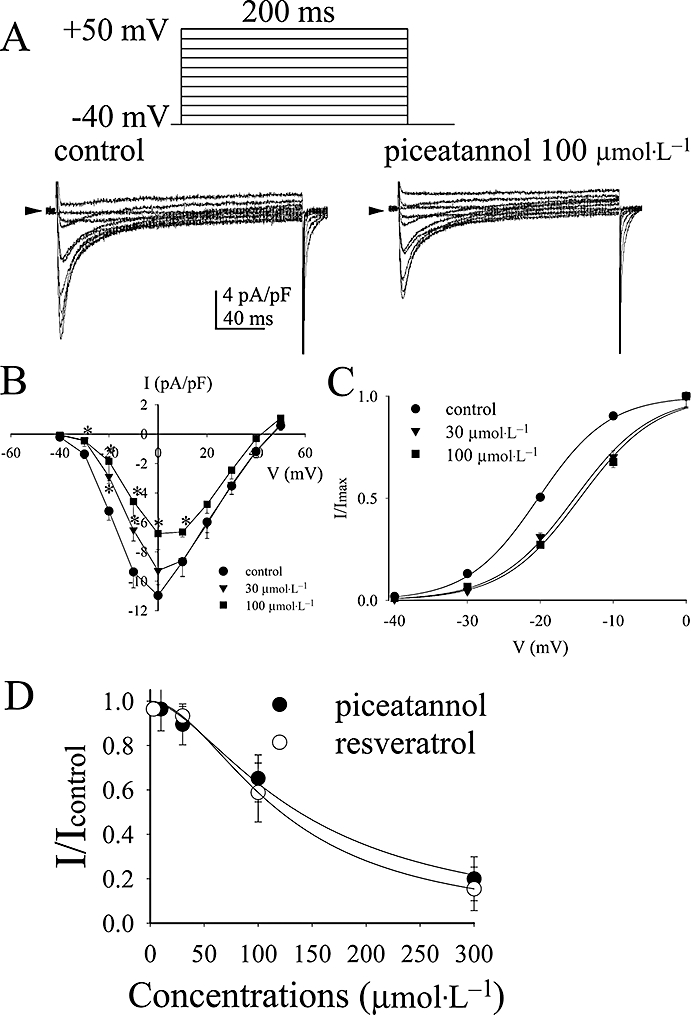
Figure 4.

(A) Effect of piceatannol on L-type calcium current of rat ventricular cells. The typical current traces of a family of depolarizing pulses from the holding potential −40 mV to +50 mV by 10 mV every step for 200 ms in the absence and presence of piceatannol 100 µmol·L−1. (B) The I-V curves and (C) the activation curves of L-type calcium channel in response to piceatannol at the concentrations of 30 µmol·L−1 and 100 µmol·L−1. Data are shown as mean ± SEM (n= 6). *P < 0.05 (n= 6) versus control group by paired t-test. (D) Comparison of the dose-dependent inhibition of ICa,L at 0 mV by piceatannol and resveratrol. The curves are fitted with Hill equation (1).
