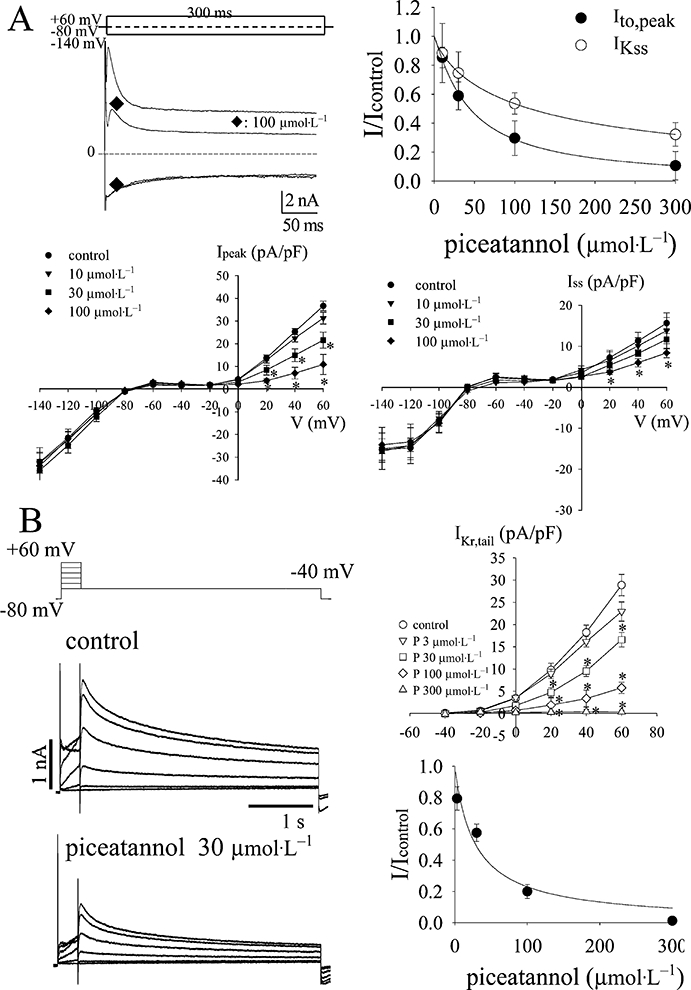
Figure 5.

(A) Effect of piceatannol on potassium channels of rat ventricular cells. Co2+ (1 mmol·L−1) was always present in the bath to block ICa,L. The left top shows the typical current traces of transient outward currents (Ito) followed by a sustained outward currents and the inwardly rectifying potassium current (IK1) in the absence and presence of piceatannol at 100 µmol·L−1. The membrane potential was held at −80 mV, and was either depolarized to +60 mV to activate the transient outward currents or hyperpolarized to −140 mV to elicit IK1 for 300 ms. The lower panael of (A) shows the I-V curves of the current density at peak (Ipeak) and at the end of 300 ms (Iss) in the absence and presence of piceatannol at the concentrations of 10, 30 and 100 µmol·L−1. The outward currents were elicited by a family of depolarization steps from −60 mV to +60 mV increased by 10 mV every step, and a 20 ms depolarization pre-pulse was preceded to eliminate the contamination of sodium current. Data are shown in mean ± SEM (n= 6), and the asterisks indicate the statistical significance between the currents of control and drug-treated groups elicited at the same voltage level by one-way anova with Duncan's new multiple range test. The right top shows the dose-dependent inhibition of Ipeak and Iss by piceatannol. The curves are fitted by the Hill equation (1). (B) Effect of piceatannol on IKr in HEK293T cells transfected with hERG encoding the alpha-subunit of IKr. IKr was elicited by a family of depolarization steps increased every 20 mV for 300 ms from holding potential at −80 mV, and followed by the repolarization at −40 mV to record the tail currents. The right top of (B) plots the I-V curves constructed by the peak amplitude of the tail currents elicited at the respective depolarization steps. Data are shown in mean ± SEM (n= 6), and the asterisks indicate the statistical significance between the currents of control and drug-treated groups elicited at the same voltage level by one-way anova with Duncan's new multiple range test. The right bottom of (B) shows the dose-dependent inhibition of IKr,tail elicited at +60 mV by piceatannol. The curve is fitted with the Hill equation (1).
