
Figure 2.
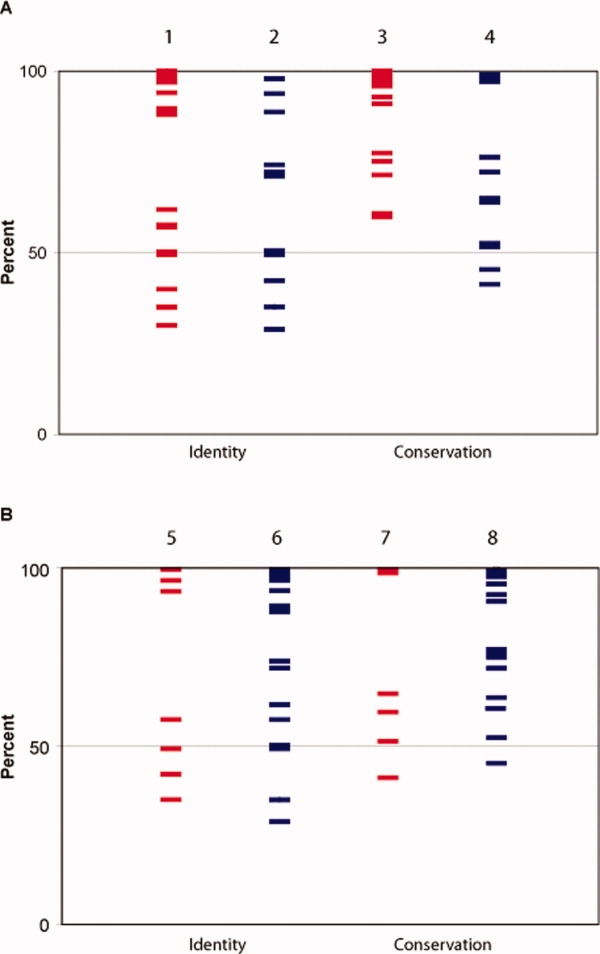
Comparison of identity and conservation of residues based on oligomerization results. Each line represents a residue mutated to alanine. Residues important for oligomerization (red) and those that did not show a sensitive phenotype (blue) in the regulatory domain (Panel A) or full-length OxyR fusions (Panel B) are plotted based on the identity (columns 1, 2, 5, and 6) or conservation (columns 3, 4, 7, and 8) at that particular position within a family of determined OxyR orthologs, as described in the Methods. Overall, the seven hot spots had conservation scores as follows: H125, 51%, E126, 100%, H218, 65%, R228, 97%, M230, 99%, S235, 41%, and E248, 60%.