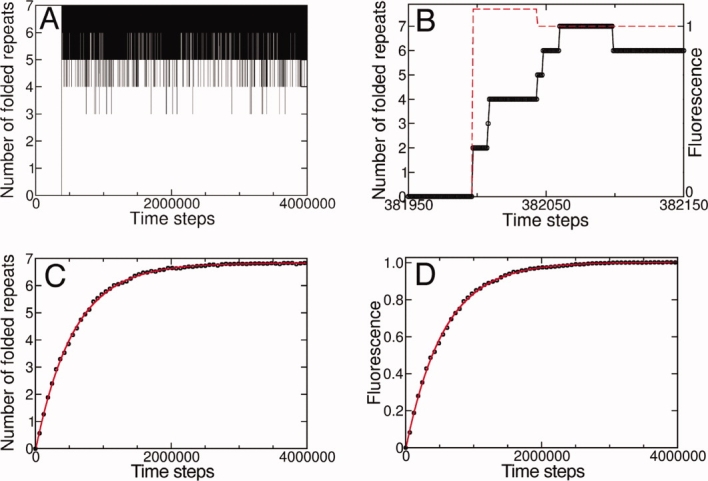
Figure 3.

Landscape-based folding simulations of the Notch ankyrin domain. (A) A simulated folding trajectory of an individual molecule indicates an abrupt folding transition at time step ∼400,000. (B) A magnified view of the transition region indicates transiently populated states. The simulated fluorescence signal (red dashed line) undergoes an abrupt jump that is coincident with the first folding event (to the two repeat level). The average number of folded repeats (C) and simulated fluorescence (D) averaged from 1000 folding trajectories are well-fitted by a single exponential (solid red line). The time steps are scaled (1:105) for clarity. [Color figure can be viewed in the online issue, which is available at www.interscience.wiley.com.]
