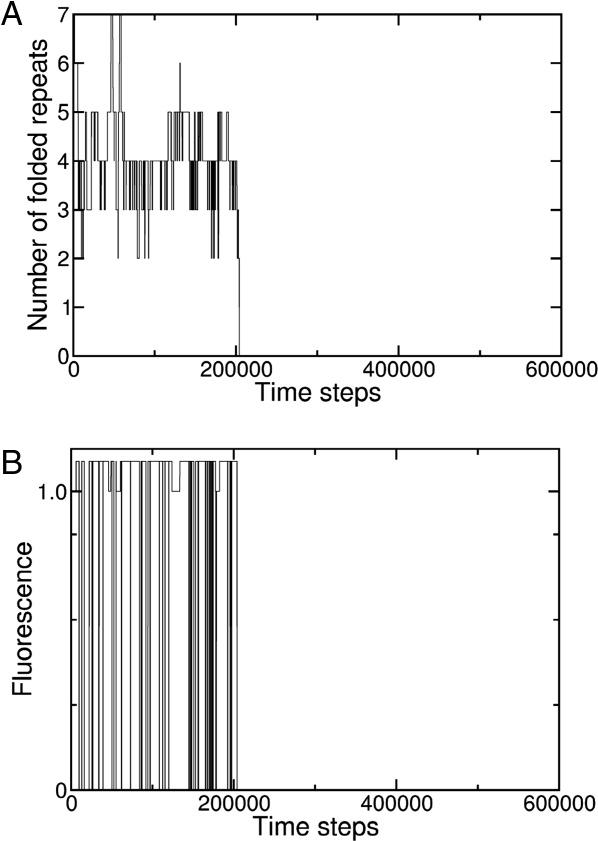
Figure 5.

Simulated trajectories of unfolding of individual Notch ankyrin domain molecules. An unfolding trajectory generated from the landscape-based model at 5M urea; progress is represented by the number of folded repeats (A) and by fluorescence (B). Although the time variation in the number of folded repeats is complex, a state with four folded repeats is preferentially populated, consistent with the relatively low free energy of the 2345 state. The time steps are scaled as in Figure 3.
