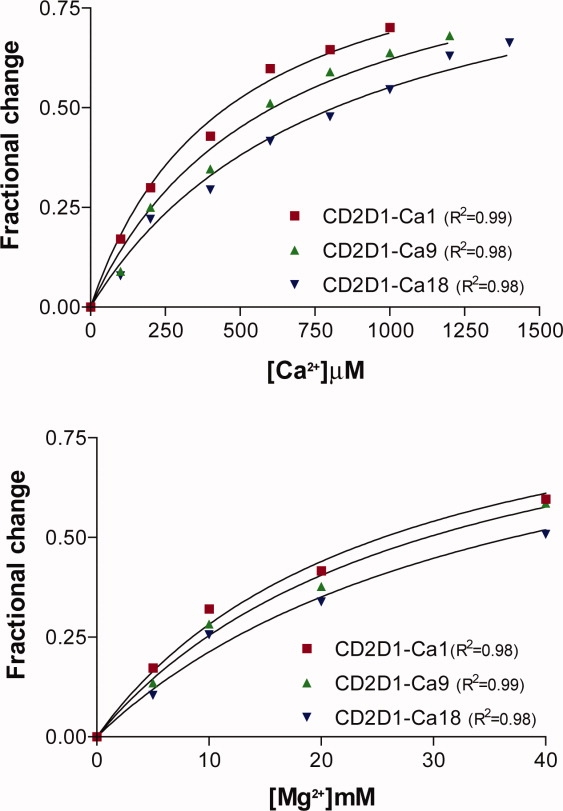
Figure 6.

Fractional changes in protein–terbium fluorescence in the presence of increasing concentrations of competing metal ions (i.e., calcium and magnesium). ([Tb3+] = 150 μM, [Protein] = 4 μM). [Color figure can be viewed in the online issue, which is available at www.interscience.wiley.com.]
