
Figure 2.
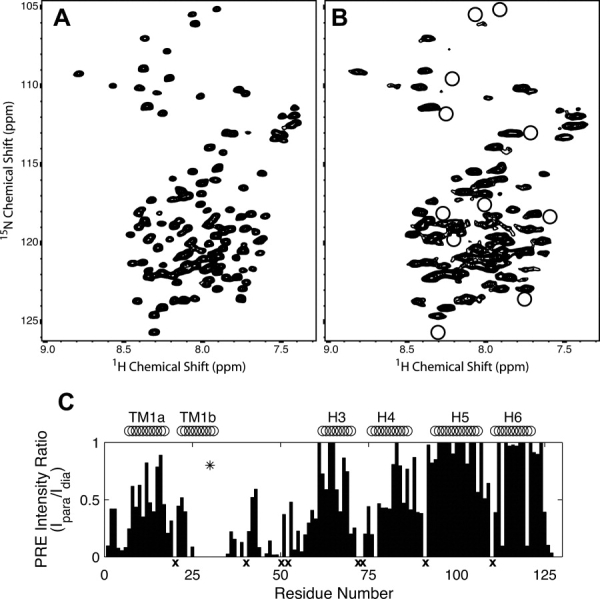
A comparison of 1H/15N-HSQC spectra of samples with diamagnetic and paramagnetic labels. Spectra acquired for diamagnetic dMTSL-labeled (A) and paramagnetic MTSL-labeled (B) F30C-Rv1761c illustrate resonance broadening due to paramagnetic relaxation enhancement (PRE). Residues in the paramagnetic sample (B) that were broadened so that they were no longer detectable are circled. An intensity plot shows the normalized PRE intensity ratio (Ipara/Idia) used to calculate PRE-derived distances used for Rv1761c structural calculations (C). The location of the spin label at F30C (asterisk) and locations of the TM helix and EM helices H3, H4, H5, and H6 are also shown. Residues for which no 1H/15N resonances were observed are marked with an x (C).