
Figure 3.
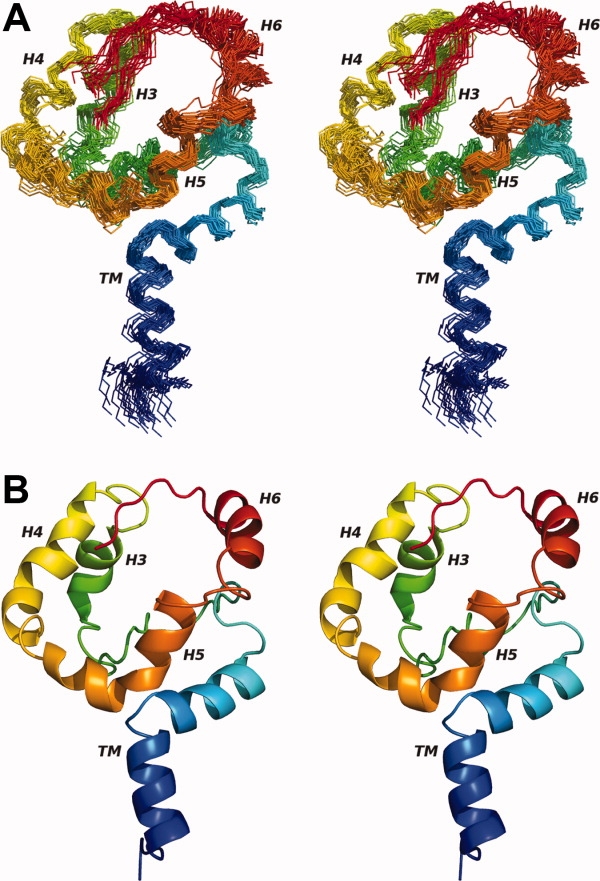
The 30 lowest energy backbone structures (A) are shown in a wide-eyed stereo diagram along with a ribbon diagram of the lowest energy structure (B). The ribbon representation clearly shows the kink of the TM helix and helical propensity of the EM domain. Both diagrams are colored from blue (amino terminus) to red (carboxyl terminus). Structures are aligned to the average backbone structure using all NH, Cα, and C′ atoms. Figure generated using PyMOL.44