
Figure 6.
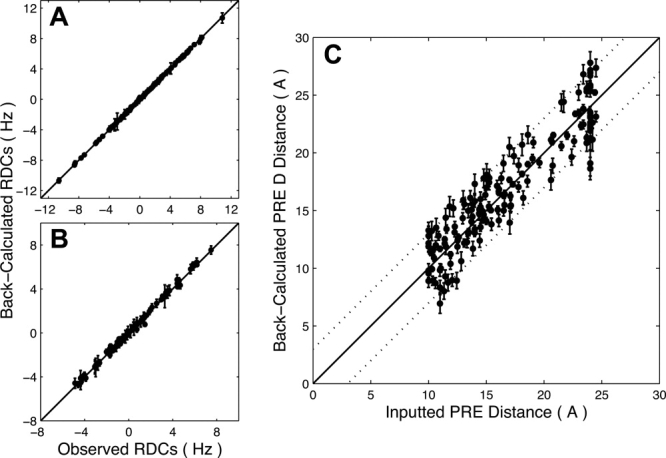
Good correlations are seen for observed and back-calculated RDC and PRE data. Correlation coefficients were r = 0.999 for 5.5% (A) and r = 0.997 for 5% 20-A (B) polyacrylamide gel RDC data. Observed RDC data points are the experimental values used for the structure calculation. Back-calculated RDC data points represent the average value of each RDC determined by SVD using Xplor-NIH for the 30 calculated structures. Error bars represent the rmsd for each back-calculated dipolar coupling over the family of 30 structures (error bars for some 5.5% neutral PAG and 5% 20-A PAG data points are smaller than the symbols shown). Average PRE distances calculated from the structure family (back-calculated) agree well with the PRE distance data used for the structural calculations (C). The correlation coefficient for PRE distance data was r = 0.926. Dotted lines indicate ±3 Å error bounds for the PRE distance data. PRE distance error bars represent the rmsd for each back-calculated PRE distance over the family of 30 structures.