
Figure 2.
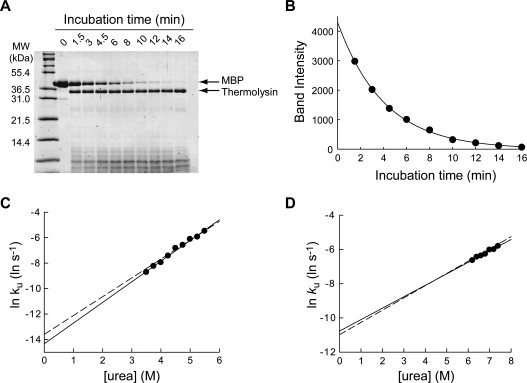
Determination of unfolding kinetic constants by pulse proteolysis. (A) Unfolding of MBP in 5.5M urea was monitored by pulse proteolysis. The bands corresponding to MBP and thermolysin are indicated by arrows. The amount of intact MBP decreases overtime as unfolded MBP is digested by pulse proteolysis. (B) The quantified band intensities from the gel in (A) are plotted against time. An unfolding kinetic constant (ku) of 0.25 ± 0.01 min−1 was determined by curve-fitting of the plot to a first-order rate equation (r2 = 0.9989). (C) Unfolding kinetic constants (ku) of MBP were determined with varying concentrations of urea. The plot of lnku versus [urea] shows the empirically known linear correlation. By fitting the plot to Eq. (7), the mu value and kunf(H2O) were determined to be 0.96 ± 0.04 kcal/(mol M) and (6.0 ± 1.6) × 10−7 s−1, respectively. For comparison, the linear regression line of unfolding kinetic constants of MBP determined by circular dichroism is shown (dashed line). (D) Unfolding kinetic constants (ku) of RNase H were determined with varying concentration of urea. By fitting the plot to Eq. (7), the mu and kunf(H2O) values were determined to be 0.40 ± 0.05 kcal/(mol M) and (2.1 ± 0.1) × 10−5 s−1, respectively. For comparison, the linear regression line of unfolding kinetic constants of RNase H determined by circular dichroism is shown (dashed line).