
Figure 3.
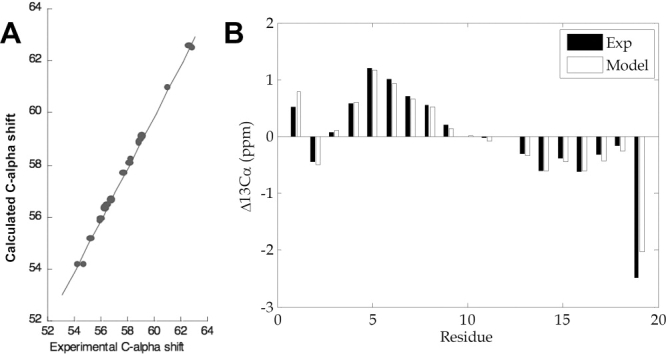
Comparison of experimental Cα chemical shifts and Cα chemical shifts calculated using the “worst” model; that is, the model with the highest rms difference between the calculated and experimental result. (A) Relationship between experimental and calculated absolute Cα chemical shifts. (B) Comparison of experimental and calculated Cα secondary chemical shifts.