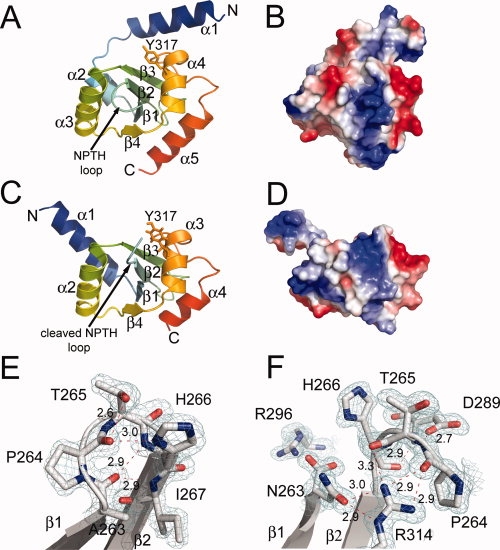
Figure 1.

(A) Ribbon-drawing of the crystal structure of the noncleaved YscUN263A mutant and (B) the electrostatic potential mapped onto the solvent exposed surface of YscUN263A in the same orientation. (C) Ribbon drawing of the crystal structure of the cleaved form of YscU (YscUcleaved) and (D) the electrostatic potential mapped onto the surface of YscUcleaved. (E) The molecular interactions of the NPTH residues located on the β-turn between strands β1 and β2 in the YscUN263A structure and (F) after cleavage in the YscUcleaved structure with carbon (gray), nitrogen (blue), and oxygen (red) atoms shown in stick form. The 2Fo-Fc electron density maps are shown contoured at 1.5 σ level. [Color figure can be viewed in the online issue, which is available at www.interscience.wiley.com.]:
