
Figure 3.
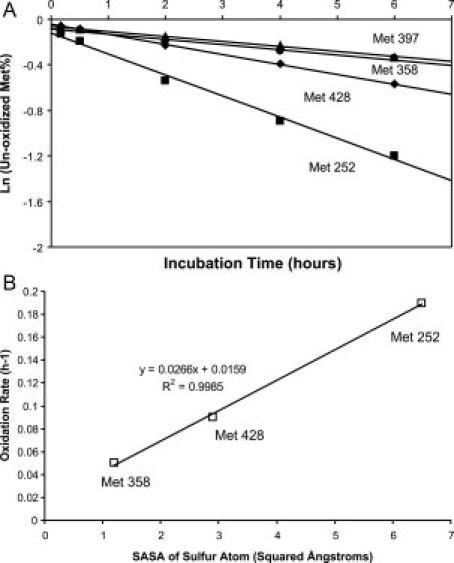
A: Kinetics of methionine oxidation. Oxidation rates of each methionine (square for Met 252, diamond for Met 428, circle for Met 358, and triangle for Met 397) were determined from the slopes of the linear fits through the data. B: The correlation between oxidation rates and solvent accessible surface area of sulfur atom for each methionine.