Figure 4.

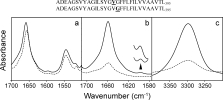
ATR-FTIR spectra of peptide ADE-TM reconstituted in DMPC lipid bilayers. (A) Non polarized infrared spectra of the amide I and II region in H2O, either at low hydration (solid line) or hydrated in D2O (broken line). The small reduction in amide II intensity is due to H/D exchange. (B) amide I region and isotopic 13C=18O label (residue V381), centered at 1590 cm−1 (see insert), obtained at 0° (solid line) or 90° (broken line) polarization. (C) same as in B, but corresponding to the amide A of the spectrum. The synthetic peptide used and the position of the 13C=18O isotopic labels are indicated at the top of the figure.
