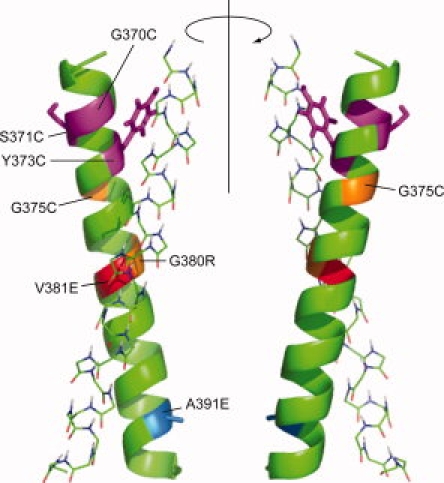
Figure 5.

Model of the homodimeric human FGFR3-TM. Homodimeric model for human FGFR3-TM that is consistent with SSID data and with evolutionary conservation, represented by cluster '1′ in Figure 3(b)(b). Residues involved in pathological mutations (see main text) are indicated with different colors on a green helix. For clarity, for one of the α-helices, only the backbone is shown. [Color figure can be viewed in the online issue, which is available at www.interscience.wiley.com.]:
