
Figure 1. Statistical parametric map of relative increase in gray matter concentration in bilateral amygdala in BPD group compared to Control group.
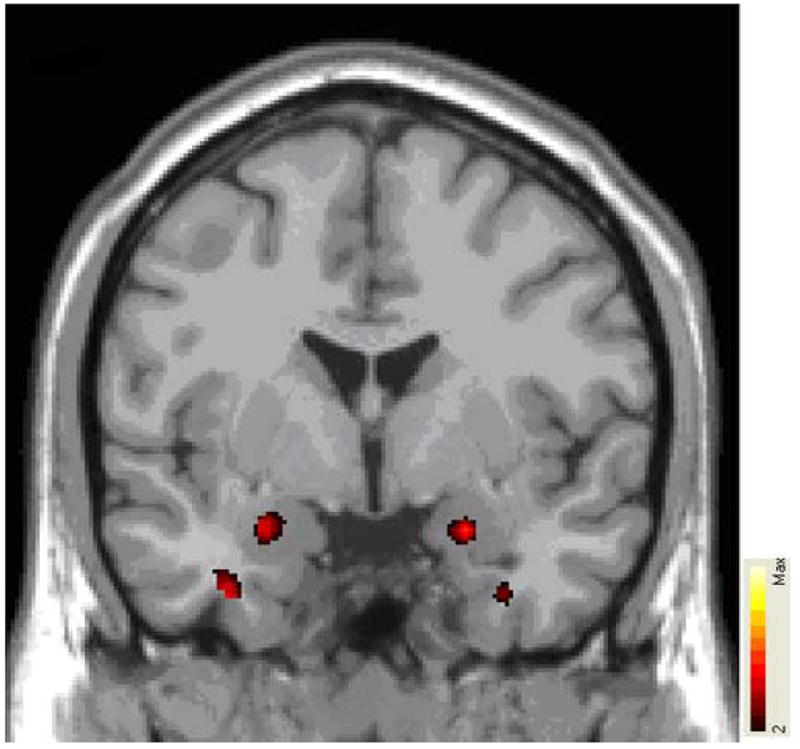
Colored areas represent significant between-group differences in signal intensity of gray matter (expressed as color-coded t statistics), overlaid on MNI single-subject template. Colored areas represent regions where BPD group has significantly increased gray matter concentration (e.g. bilateral amygdala). See text for details of image analysis. Image orientation according to neurological convention (e.g. right hemisphere to the right).